8. The Photoelectric Effect
Module
Particle Nature of Light · Experiment 1
Try it live
Explore this on the interactive simulator with real-time sliders and graphs: 🔬 Launch in Simulator
Aim
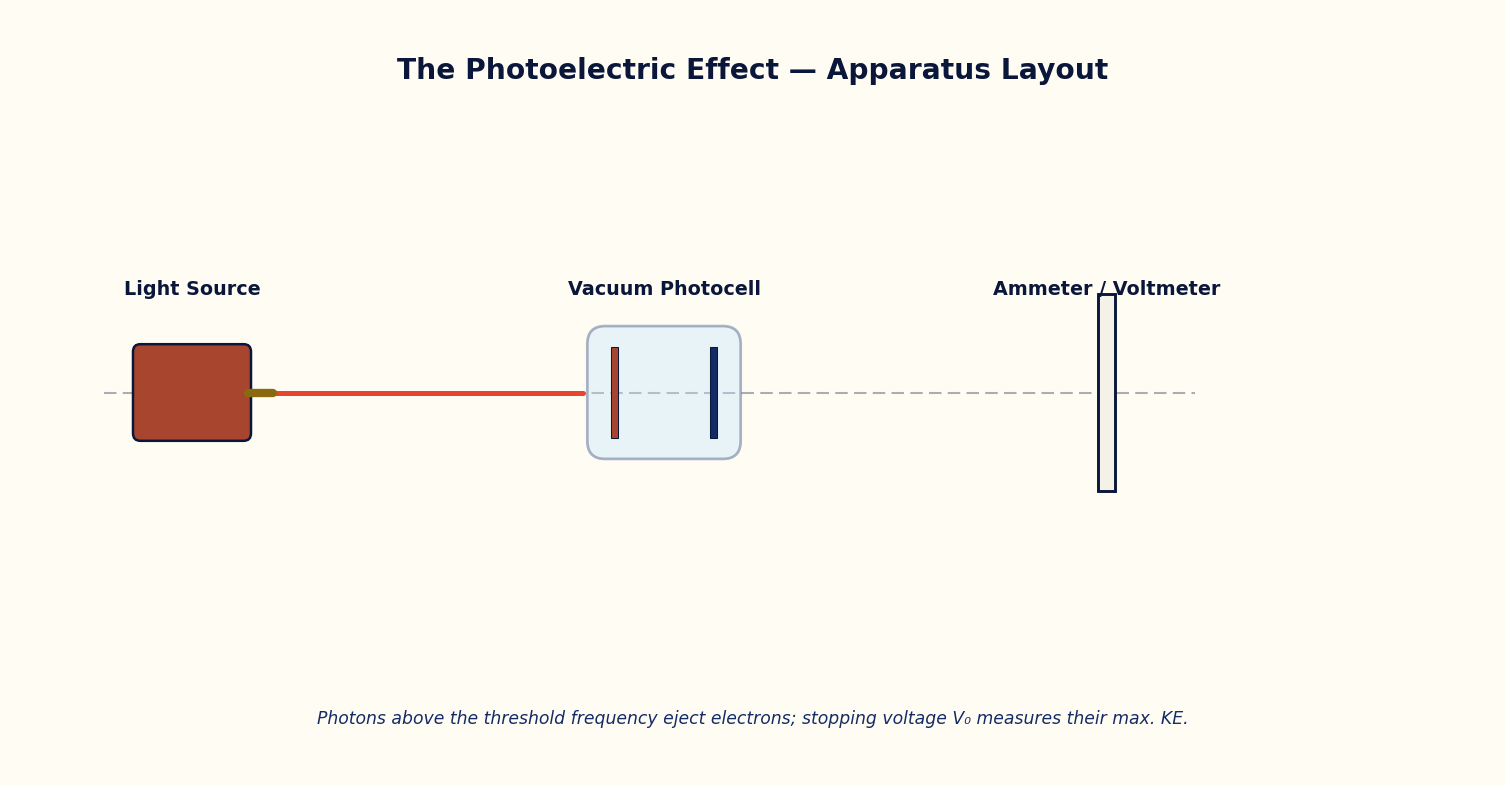
To study the photoelectric effect and verify Einstein's photoelectric equation by measuring the stopping voltage as a function of incident photon energy for different metals.
Theoretical Background
When light of sufficiently high frequency falls on a metal surface, electrons are ejected instantaneously from the surface. Classical wave theory predicts that the kinetic energy of ejected electrons should increase with the intensity of the incident light, but experiment shows otherwise: below a threshold frequency ν0 (characteristic of the metal), no electrons are ejected at all, however intense the light.
Einstein explained this in 1905 by treating light as a stream of quanta (photons), each carrying energy E = hν. When a photon is absorbed by an electron in the metal, part of its energy (the work function φ) is used to free the electron from the metal, and the remainder appears as the electron's kinetic energy: KE_max = hν − φ.
Because each photon interacts with (at most) one electron, increasing the light intensity increases only the number of photons arriving per second — and hence the photoelectric current — without changing the maximum kinetic energy of individual electrons, which depends solely on the photon frequency. The kinetic energy is measured experimentally as a stopping voltage V0, the reverse potential just sufficient to stop the most energetic electrons: eV0 = hν − φ.
Governing Formulas
Photon energy:
Einstein's photoelectric equation:
Stopping voltage:
Simulator Controls
| Control | Symbol | Range | Unit |
|---|---|---|---|
| Metal (work function φ) | φ | 2.14 – 5.10 | eV (Na, K, Cu, Au) |
| Photon wavelength | λ | 150 – 700 | nm |
| Light intensity | I | 10 – 100 | % |
Procedure
- Select a metal (e.g. Copper, φ = 4.70 eV) and set the light intensity to a fixed value.
- Vary the wavelength λ in steps, noting for each step whether the wavelength is above or below the threshold for that metal, and record the photon energy E, KE_max and stopping voltage V0.
- Repeat the run for at least two other metals of different work function and tabulate V0 versus ν for each.
- At a wavelength well above threshold, vary the light intensity alone and confirm that V0 (and hence KE_max) stays constant while only the qualitative 'more electrons ejected' behaviour changes.
- Plot V0 against frequency ν for each metal on the same axes.
Observation Table
Table: Stopping voltage as a function of photon frequency for a chosen metal
| S. No. | Metal | φ (eV) | λ (nm) | ν = c/λ (×10¹⁴ Hz) | E = hν (eV) | V0 = (E−φ)/e (V) |
|---|---|---|---|---|---|---|
| 1 | ||||||
| 2 | ||||||
| 3 | ||||||
| 4 | ||||||
| 5 | ||||||
| 6 | ||||||
| 7 | ||||||
| 8 |
Graph
Plot Stopping voltage V0 (V) (y-axis) against Frequency ν (×10¹⁴ Hz) (x-axis).
Expected trend: a straight line of slope h/e, with x-intercept at the threshold frequency ν0 = φ/h.
V0 vs ν for one or more metals — parallel lines with different intercepts
Calculation
- For each metal, plot V0 against ν; the slope of the best-fit line should equal h/e (~4.14×10⁻¹⁵ V·s).
- Read the x-intercept of each line to obtain the threshold frequency ν0, and hence the work function φ = hν0.
- Compare the graph-derived φ with the value set on the simulator.
Result
Table: Verification of Einstein's photoelectric equation
| Metal | φ set (eV) | φ from graph (eV) | h/e from slope | % deviation |
|---|---|---|---|---|
| 1 | ||||
| 2 | ||||
| 3 |
Maximum Permissible Error
V₀ = (hν − φ)/e is an affine (not multiplicative) relation, so errors from frequency (via the wavelength selector's least count) and from the work function uncertainty simply add.
Precautions
- Ensure at least some wavelengths chosen are below threshold (no photoemission) to correctly identify ν0.
- Do not confuse the effect of intensity (affects current/count rate only) with the effect of frequency (affects KE_max/V0).
Self-Check Quiz
1. Below the threshold frequency ν0, increasing the light's intensity (but not its frequency) causes:
- A) More electrons to be ejected with higher energy
- B) No electrons to be ejected at all, however intense the light
- C) Electrons to be ejected but with lower energy
- D) The metal to melt
Answer: B — This was the key observation classical wave theory could not explain — below ν0, no photoelectrons appear regardless of intensity.
2. In Einstein's equation KE_max = hν − φ, what does φ represent?
- A) The photon's frequency
- B) The kinetic energy of the fastest electron
- C) The work function — the minimum energy needed to free an electron from the metal
- D) The stopping voltage
Answer: C — φ is a property of the metal itself: the energy 'cost' of liberating an electron from the surface.
3. Measuring the stopping voltage V0 gives you a direct measurement of:
- A) The photon's wavelength
- B) The work function alone
- C) The maximum kinetic energy of the ejected photoelectrons (eV0 = KE_max)
- D) The light's intensity
Answer: C — V0 is defined as exactly the retarding voltage that stops even the fastest photoelectrons, so eV0 = KE_max directly.
4. On a graph of stopping voltage V0 versus frequency ν, the slope of the straight line equals:
- A) The work function φ
- B) h/e (Planck's constant divided by electron charge)
- C) The threshold frequency
- D) The speed of light
Answer: B — From V0 = (hν − φ)/e, V0 is linear in ν with slope h/e — this is historically how Planck's constant was first measured experimentally.
Viva-Voce Questions
- Why could the photoelectric effect not be explained by the classical wave picture of light?
- What is the physical significance of the universal slope h/e obtained from the V0–ν graph?
- Why does photoelectric current not begin until the incident frequency exceeds a threshold value, regardless of intensity?
- How is the work function of a metal determined from a graph of stopping potential versus frequency?
- Why does increasing the light intensity increase the photocurrent but not the maximum kinetic energy of the photoelectrons?
- What was significant about Einstein's explanation of the photoelectric effect that the classical wave theory of light could not account for?
- What is the physical significance of the slope of the V₀ versus ν graph?