Dielectric Polarization & the Clausius–Mossotti Relation
Aim
To study how an external electric field polarizes a dielectric material, relate the macroscopic polarization to the microscopic atomic polarizability using the Clausius–Mossotti relation, and observe the resulting bound charges.
Theoretical Background
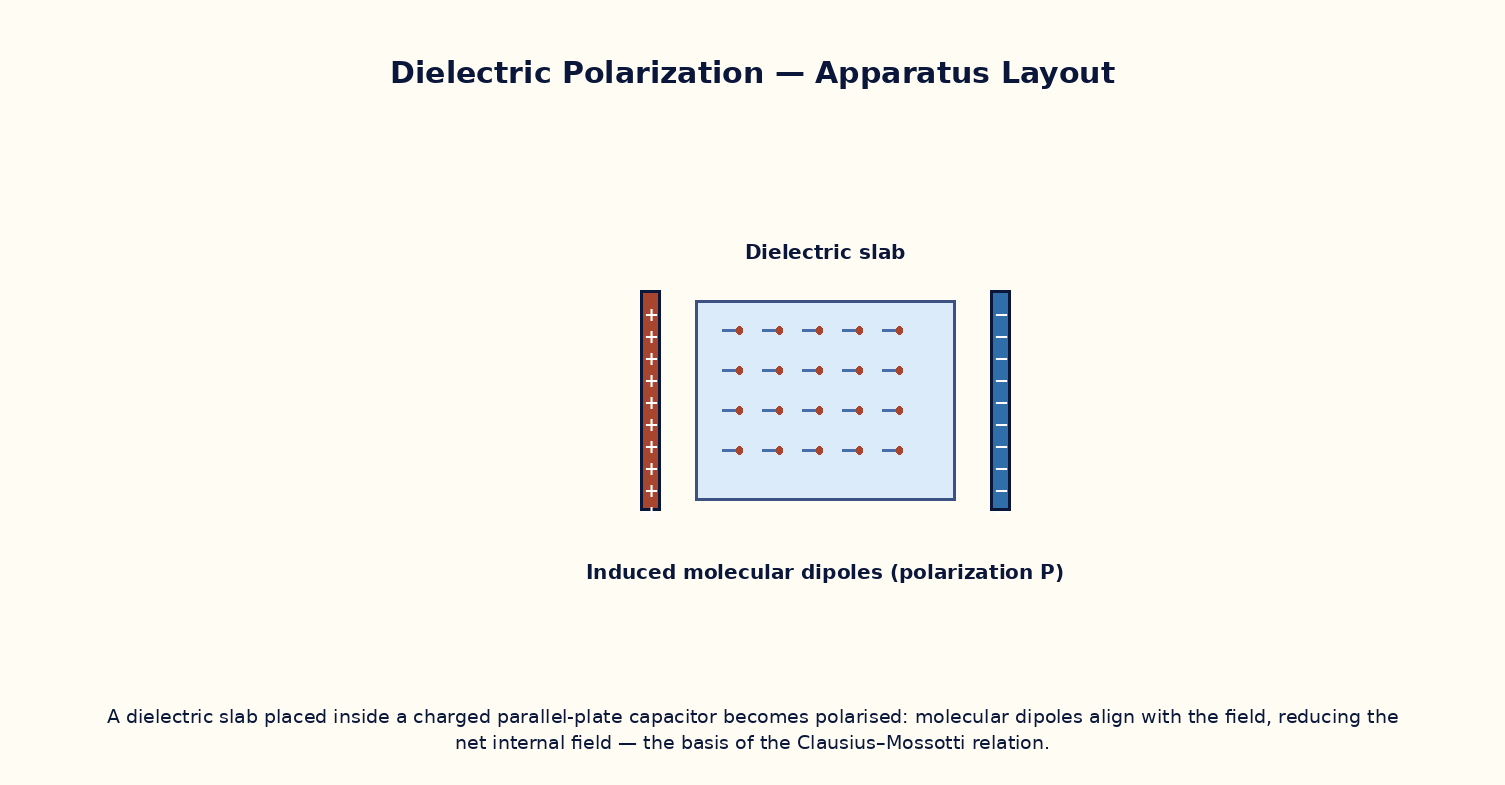
When a dielectric is placed in an external field E, its constituent atoms/molecules develop induced dipole moments (or, for polar molecules, their permanent dipoles partially align), producing a macroscopic polarization P = ε₀χe·E, where χe = εr − 1 is the electric susceptibility. This polarization manifests as bound surface charge σ_b = P·n̂ at the dielectric's surfaces (and bound volume charge where P is non-uniform), which partially cancels the external field inside the material — the origin of the dielectric constant's field-reducing effect seen in the capacitor experiment. The microscopic atomic polarizability α (dipole moment induced per unit local field) is related to the macroscopic εr through the Clausius–Mossotti relation: (εr−1)/(εr+2) = Nα/3ε₀, where N is the number density of polarizable atoms/molecules — this correctly accounts for the fact that each molecule sees not just the applied field but also the field of all the other induced dipoles around it (the local-field correction).
Governing Formula
| Symbol | Meaning |
|---|---|
| P | macroscopic polarization (C/m²) |
| εr | relative permittivity (dielectric constant) |
| E | applied macroscopic field (V/m) |
| N | number density of molecules (m⁻³) |
| α | molecular polarizability (C·m²/V) |
Interactive Controls
Launch the simulator and use the following controls on the Dielectric Polarization & the Clausius–Mossotti Relation panel:
| Control | Symbol | Range | Default |
|---|---|---|---|
| Number density | N | 1–50 ×10²⁸ m⁻³ | 20 ×10²⁸ m⁻³ |
| Molecular polarizability | α | 1–50 ×10⁻⁴⁰ C·m²/V | 15 ×10⁻⁴⁰ C·m²/V |
| Applied field | E | 1–100 kV/m | 20 kV/m |
Procedure
- For a chosen N and α, use the Clausius–Mossotti relation to compute εr, and verify it against the simulator's directly-modelled dielectric response.
- Increase N (denser material) and observe εr rising, eventually approaching the 'polarization catastrophe' limit where Nα/3ε₀ → 1.
- At fixed N, α, apply an external field E and read off the induced polarization P; verify P = ε₀(εr−1)E.
- Zoom into the molecular view and observe individual dipoles growing (or aligning, for polar molecules) proportionally with E.
- Compute the bound surface charge density σ_b = P at the dielectric's outer faces and compare it with the field-reduction observed in the parallel-plate-capacitor experiment.
- Compare the Clausius–Mossotti prediction with the simpler (and less accurate at high Nα) approximation εr − 1 ≈ Nα/ε₀ that ignores the local-field correction.
Observation Table
| S. No. | N (×10²⁸ m⁻³) | α (×10⁻⁴⁰ C·m²/V) | εr (Clausius–Mossotti) | Applied field E (kV/m) | Polarization P (μC/m²) | |---|---|---|---|---|---|| | | | | | | | | | | | | | | | | | | | | | | | | | | | | | | | | | | |
Graph
Dielectric Constant vs Number Density N — εr rises steeply as Nα/3ε₀ → 1
Calculations
Use the governing formula above with your tabulated observations to compute the required result for each row. Show at least one complete sample calculation with units.
Result
| Case | εr computed | Bound charge σ_b | Remarks | |---|---|---|---|| | | | | |
Precautions
- Keep Nα/3ε₀ below 1 for a physically stable dielectric; values approaching or exceeding 1 signal the (unphysical, in this simple model) polarization catastrophe/ferroelectric-like instability.
- Distinguish clearly between the macroscopic applied field E and the larger local field seen by each individual molecule.
- Vary only one of N, α, E at a time when tabulating results.
- Remember bound charges are real charges bound to atoms, distinct from free charges on the capacitor plates.
Maximum Permissible Error
εr is a nonlinear function of Nα, so its propagated error is evaluated numerically from the fractional errors of N and α rather than a simple closed form.
Viva-Voce Questions
- Define polarization P and relate it to the electric susceptibility χe.
- Derive the Clausius–Mossotti relation, explaining the role of the local (Lorentz) field correction.
- What is meant by 'bound charge', and where does it appear on/in a polarized dielectric?
- Why does the simple relation εr−1 ≈ Nα/ε₀ (without the local-field correction) become inaccurate at high densities?
- How does the Clausius–Mossotti relation connect to the Lorentz–Lorenz relation for the refractive index?
- Explain qualitatively what a 'polarization catastrophe' represents physically (link to ferroelectricity).