Hall Effect — Carrier Density & Sign of Charge Carriers
Aim
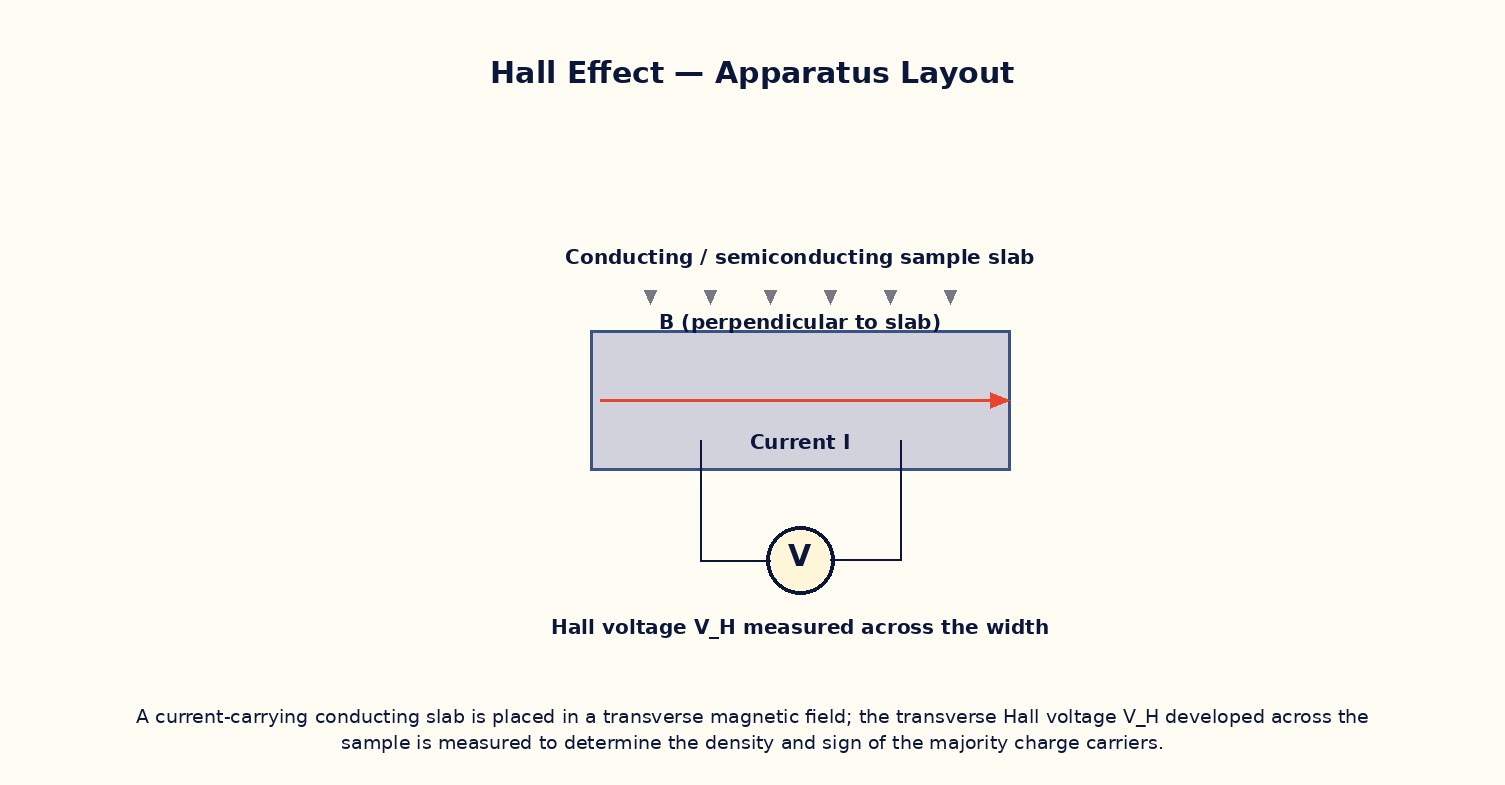
To measure the Hall voltage developed across a current-carrying conducting slab placed in a transverse magnetic field, and use it to determine the density and sign (electron or hole) of the majority charge carriers in the sample.
Theoretical Background
When a current-carrying conductor is placed in a magnetic field perpendicular to the current, the moving charge carriers experience a sideways magnetic (Lorentz) force, which deflects them towards one edge of the sample. This charge accumulation continues until the resulting transverse electric field exerts an equal and opposite force on the carriers, establishing a steady transverse potential difference known as the Hall voltage V_H. The sign of V_H directly reveals whether the majority carriers are negative (electrons, as in most metals and n-type semiconductors) or positive (holes, as in p-type semiconductors), since the direction of the deflecting force depends on the sign of the moving charge. The magnitude of V_H is inversely proportional to the carrier density n, which is why doped semiconductors — with carrier densities many orders of magnitude lower than metals — are used in practical Hall-effect sensors and probes, giving a readily measurable voltage for a modest current and field.
Governing Formula
| Symbol | Meaning |
|---|---|
| V_H | Hall voltage measured across the sample width (V) |
| I | current through the sample (A) |
| B | transverse magnetic flux density (T) |
| n | carrier number density (m⁻³) |
| e | elementary charge (C) |
| t | sample thickness along the field direction (m) |
Interactive Controls
Launch the simulator and use the following controls on the Hall Effect — Carrier Density & Sign of Charge Carriers panel:
| Control | Symbol | Range | Default |
|---|---|---|---|
| Current through sample | I | 1–100 mA | 20 mA |
| Transverse magnetic field | B | 5–500 mT | 150 mT |
| Carrier density (doped semiconductor sample) | n | 0.5–50 ×10²⁰ m⁻³ | 5 ×10²⁰ m⁻³ |
| Sample thickness | t | 0.05–2 mm | 0.5 mm |
Procedure
- Fix I = 20 mA and n and t at their default values, and vary B from 5 mT to 500 mT, recording V_H.
- Plot V_H versus B and verify a straight line through the origin, confirming V_H ∝ B.
- Fix B and vary I, verifying V_H ∝ I.
- Fix I and B and vary the carrier density n; verify that V_H ∝ 1/n, and note how much smaller V_H would be for a metal-like density.
- Note the polarity of V_H for the assumed carrier sign, and discuss how reversing B or I would reverse this polarity, while reversing the carrier sign (n- vs p-type) would also reverse it independently.
Observation Table
| S. No. | I (mA) | B (mT) | n (×10²⁰ m⁻³) | t (mm) | V_H (mV) | |---|---|---|---|---|---|| | | | | | | | | | | | | | | | | | | | | | | | | | | | | | | | | | | |
Graph
Hall voltage V_H vs magnetic field B
Calculations
Use the governing formula above with your tabulated observations to compute the required result for each row. Show at least one complete sample calculation with units.
Result
| Quantity | Slope of V_H vs B (→ carrier density n) | Expected value | % deviation | |---|---|---|---|| | | | | |
Precautions
- Ensure the magnetic field is strictly perpendicular to both the current direction and the sample's broad face.
- Use a thin sample (small t) and a low carrier density for a measurable Hall voltage, as is done with doped-semiconductor Hall probes.
- Avoid stray fields or nearby ferromagnetic objects that could add an unwanted component to B.
- Change only one variable (I, B, n, or t) at a time when tabulating.
Maximum Permissible Error
V_H = IB/(net) is a product/quotient of four measured quantities, so all four fractional errors add directly.
Viva-Voce Questions
- Explain the physical origin of the Hall voltage in terms of the Lorentz force on moving charge carriers.
- How does the sign of the Hall voltage reveal whether the majority carriers are electrons or holes?
- Why are semiconductors, rather than metals, generally used in practical Hall-effect sensors?
- Derive the expression for the Hall coefficient R_H and relate it to the carrier density.
- Describe one real-world application of the Hall effect (e.g. current sensing, position sensing).