Electrostatic & EM Shielding Effectiveness of a Faraday Cage
Aim
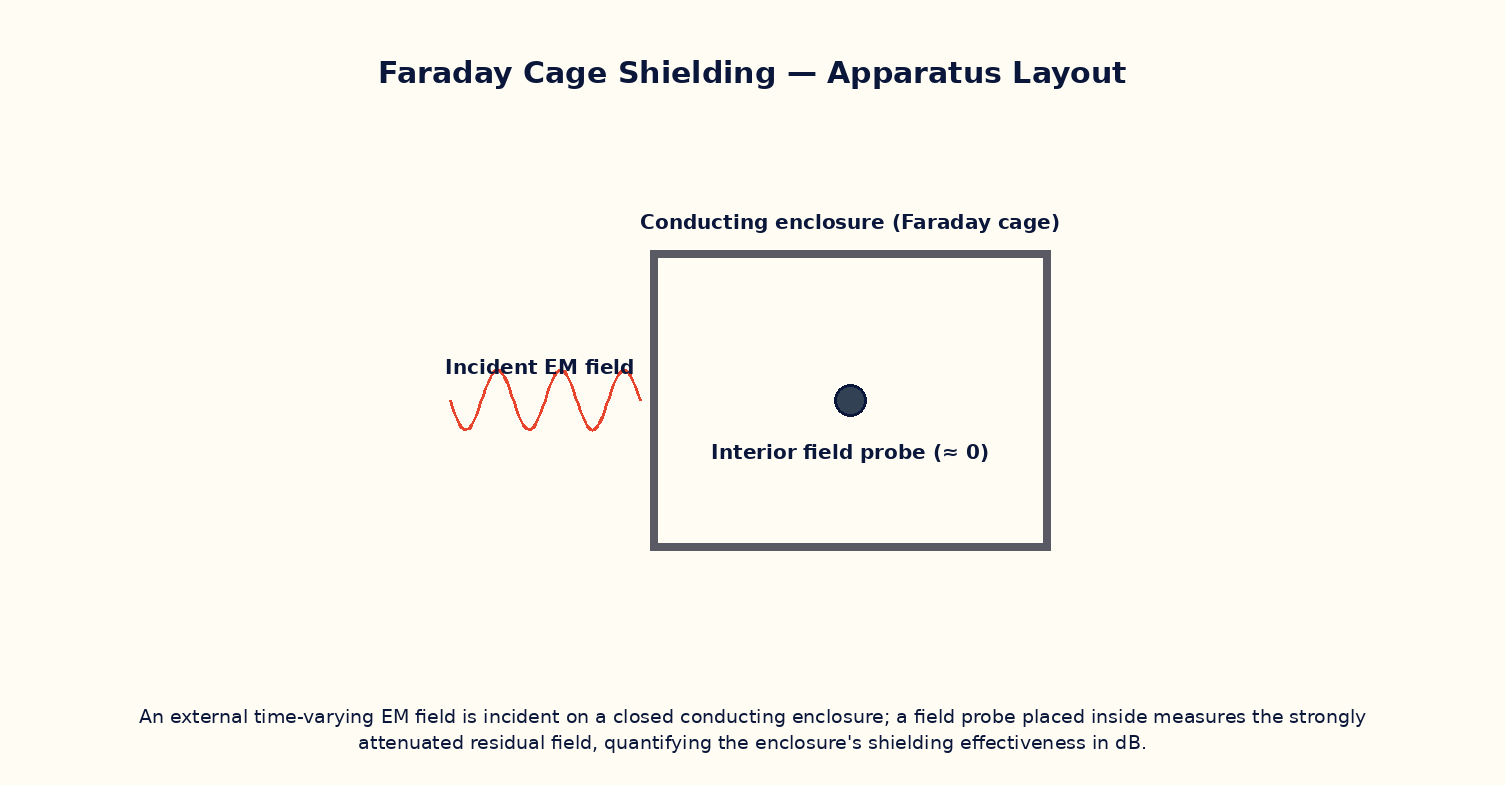
To compute the shielding effectiveness of a conducting enclosure (Faraday cage) as a function of wall thickness, conductivity and frequency, via the skin-depth attenuation of the incident field as it penetrates the conducting wall.
Theoretical Background
A Faraday cage — a closed or nearly closed conducting enclosure — shields its interior from external electric and electromagnetic fields. For a static or slowly varying electric field, free charges in the conductor simply rearrange themselves to cancel the field inside completely, regardless of wall thickness. For a time-varying electromagnetic field, the story is more subtle: the field does penetrate into the conducting wall, but its amplitude decays exponentially with depth according to the material's skin depth δ = √(2/(ωμσ)), which itself shrinks as frequency and conductivity increase. The resulting absorption loss, expressed in decibels, is approximately SE(dB) = 8.69·t/δ, where t is the wall thickness — so even a modest thickness of a good conductor provides enormous attenuation at radio frequencies, which is why thin metal foil or fine mesh is often sufficient for practical RF shielding (real enclosures are also limited by seams and apertures, not modelled here).
Governing Formula
| Symbol | Meaning |
|---|---|
| SE | shielding effectiveness (dB), pure absorption loss |
| t | wall / mesh thickness (m) |
| δ | skin depth of the wall material at frequency f (m) |
| σ | wall conductivity (S/m) |
| ω | angular frequency, ω = 2πf |
| μ | permeability of the wall material (≈ μ₀ for non-magnetic metals) |
Interactive Controls
Launch the simulator and use the following controls on the Electrostatic & EM Shielding Effectiveness of a Faraday Cage panel:
| Control | Symbol | Range | Default |
|---|---|---|---|
| Wall / mesh thickness | t | 0.05–5 mm | 1 mm |
| Wall conductivity | σ | 1–60 ×10⁶ S/m | 35 ×10⁶ S/m |
| Field frequency | f | 0.1–1000 MHz | 100 MHz |
Procedure
- Fix t and σ at their default values and vary f from 0.1 MHz to 1000 MHz, recording the skin depth δ and shielding effectiveness SE at each step.
- Plot SE versus log f and note how rapidly shielding improves with increasing frequency for a fixed wall thickness.
- Fix f and vary the wall thickness t, verifying SE ∝ t.
- Fix f and t, and vary the conductivity σ (e.g. comparing copper-like and steel-like values), and observe the effect on δ and SE.
- Discuss why this idealised absorption-loss model tends to over-predict real-world shielding effectiveness, and what additional loss mechanisms (seams, apertures) a real enclosure design must also consider.
Observation Table
| S. No. | f (MHz) | t (mm) | σ (×10⁶ S/m) | δ (µm) | SE (dB) | |---|---|---|---|---|---|| | | | | | | | | | | | | | | | | | | | | | | | | | | | | | | | | | | |
Graph
Shielding effectiveness SE vs frequency f
Calculations
Use the governing formula above with your tabulated observations to compute the required result for each row. Show at least one complete sample calculation with units.
Result
| Quantity | SE at reference frequency f₀ | Expected value | % deviation | |---|---|---|---|| | | | | |
Precautions
- Remember this model captures absorption loss only; real enclosures also lose effectiveness through seams, joints and apertures.
- Static electric shielding (zero interior field) holds regardless of thickness; the finite-δ model here applies specifically to time-varying fields.
- Vary only one of t, σ, f at a time while tabulating the others.
- Use consistent SI units when computing δ and SE from the raw control values.
Maximum Permissible Error
SE = 8.69t/δ with δ ∝ 1/√(fσ), so f and σ each enter with a half-power (square-root) dependence, contributing half their fractional error.
Viva-Voce Questions
- Explain why a Faraday cage shields static electric fields completely, regardless of wall thickness.
- Define skin depth and explain why it decreases with increasing frequency.
- Derive the approximate absorption-loss formula SE ≈ 8.69t/δ.
- Why can a fine wire mesh be nearly as effective as a solid metal sheet at RF shielding?
- What other loss mechanisms, besides absorption, contribute to a real enclosure's total shielding effectiveness?